

The essential answer
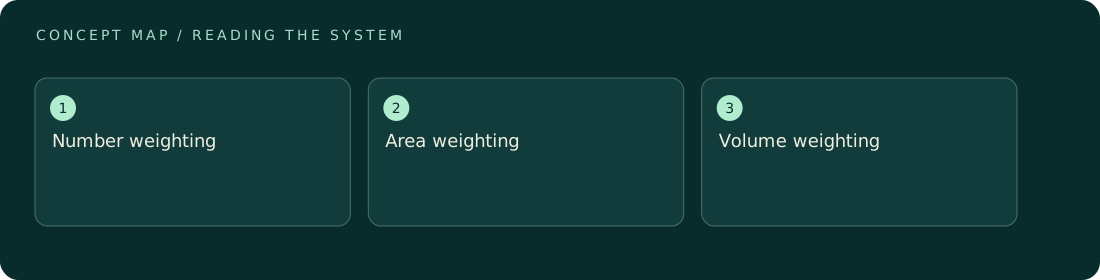
A droplet size distribution counts droplets across size classes instead of replacing them with one average diameter. That matters because number, optical area, and liquid volume weight diameter differently. A rare large droplet can carry much more water than many smaller ones. Collector collision behavior can also vary with size. Preserve the distribution whenever the question concerns both visibility and yield; a single mean can hide the particular droplets that dominate either calculation.
How to reason about it
For spherical droplets, projected area scales with diameter squared and volume with diameter cubed. These powers make the meaning of an average crucial. A number-weighted mean answers what a randomly selected droplet resembles; it does not directly describe where the mass resides. A histogram should identify bin edges, concentration units, detection limits, and whether its bars represent number or volume. Instrument losses can change those bars before any analysis begins, particularly when the sampling path favors some sizes over others. The cited measurement study documents such uncertainty; the arithmetic below is an original illustration. For interpretation, ask whether a shift reflects more droplets, larger droplets, or both. Those alternatives can lead to similar total water content while producing different settling, scattering, and interception behavior.
ILLUSTRATIVE · NOT A REPORTED RESULT
An example to work through
Assume a sample contains eight droplets of diameter 10 micrometers and one of diameter 20 micrometers. The larger droplet has eight times the volume of each smaller one because 2 cubed equals 8. It therefore carries half the total liquid volume, despite being only one ninth of the count. The number-average diameter is 100 divided by 9, about 11.1 micrometers. Substituting that average into a volume calculation for nine droplets underestimates the true total. This is a mathematical toy population, not a measured fog spectrum.
Where interpretation fails
A smooth histogram can look authoritative even when the instrument misses its smallest or largest particles. Also avoid comparing a number distribution from one instrument with a mass distribution from another as if both plots represented the same quantity. Weighting and sampling range belong beside the figure.
The next decision
Keep raw size bins when possible, and derive separate number, area, and volume summaries. Use a representative diameter only after naming its weighting. For collector comparisons, check whether both designs encountered comparable spectra; otherwise a change in incoming droplet sizes may explain the apparent improvement.
Sources & context
These sources support the concepts noted below. Our synthetic examples and research framing are educational interpretation; they are not findings from these organizations or validation of our ventures.
- Evaluating capabilities and uncertainties of FM-100 droplet measurements ↗
Droplet sizing and sampling-loss uncertainties.
Source check: Search-result abstract or official excerpt reviewed; full paper methods not audited
Educational research context, not a validated device specification or clinical protocol. Read our editorial and correction policy.