

The essential answer
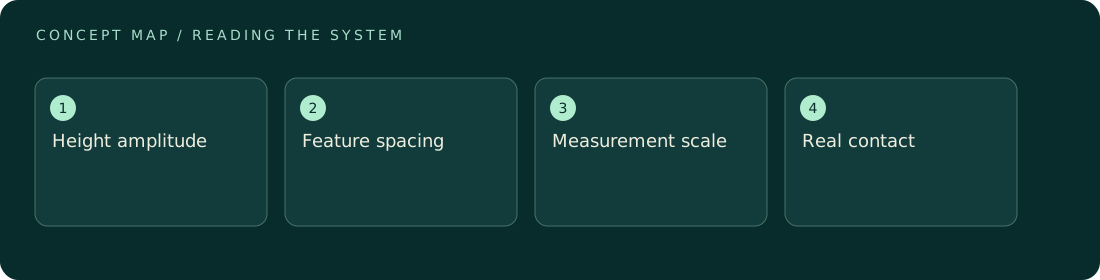
Surface roughness describes variation in surface height over a specified measurement scale and area. A single amplitude value cannot fully describe spacing, slopes, directionality, or rare high features. Those details can matter for contact, adhesion, friction, wetting, and transport. Report measurement resolution and filtering alongside the roughness metric. Two surfaces with the same average height variation can interact differently because their topography organizes contact in different ways. The appropriate descriptor depends on the physical mechanism and the scale it samples.
How to reason about it
Begin with the functional question: does the application depend on real contact patches, fluid pathways, optical scattering, or crack initiation? Each can respond to different aspects of topography. The nominal contact area is the apparent overlap, whereas the real area consists of local touching regions under the applied load. That area can change as asperities deform. A profilometer or microscope measures only the scales within its resolution and scan window; processing can remove long-wavelength waviness or short-wavelength noise, changing the reported roughness. Record the filter or cutoff rather than treating the number as instrument-independent. Directional grooves may matter even when an averaged metric appears unchanged. Compare multiple representative regions and, when needed, spatial statistics or images in addition to the scalar metric. The goal is a reproducible surface description tied to a testable contact or transport prediction.
ILLUSTRATIVE · NOT A REPORTED RESULT
An example to work through
Consider two invented one-dimensional height profiles sampled at eight equally spaced points. Profile A alternates +1 and −1 micrometer. Profile B contains four consecutive +1 values followed by four −1 values. Both have zero mean and a root-mean-square height of 1 micrometer, yet their spatial organization differs: one changes rapidly and the other forms broad plateaus. A contact model sensitive to slope or feature spacing need not predict the same behavior. This arithmetic uses ideal discrete profiles and does not represent a measured surface or account for deformation under load.
Where interpretation fails
Comparing roughness numbers from different scan sizes or filtering settings can be meaningless. A lower amplitude does not universally improve adhesion or friction, because the response depends on material deformation, contamination, and geometry. Treat a correlation within one protocol as local evidence, not a universal design rule.
The next decision
Choose roughness descriptors that match the mechanism, preserve scan and processing settings, and inspect representative topography. When contact matters, test under the intended load and environment. Report both the surface metric and the functional measurement rather than assuming that one scalar predicts the complete interface behavior.
Sources & context
These sources support the concepts noted below. Our synthetic examples and research framing are educational interpretation; they are not findings from these organizations or validation of our ventures.
- Contact Area Correction for Random Surface Roughness in Nanoadhesion — NIST ↗
Primary research background that roughness changes real contact area.
Source check: Official publication abstract/search excerpt reviewed.
Educational research context, not a validated device specification or clinical protocol. Read our editorial and correction policy.