

The essential answer
A field baseline estimates what would have happened under comparable weather without the design change. Comparing one device on a dense-fog day with another on a weak-fog day mixes device performance with environmental supply. Concurrent, matched comparisons reduce that ambiguity, although placement effects still need attention. Report absolute water yield and exposure-normalized metrics together. A percentage improvement is informative only when the baseline quantity, event conditions, and uncertainty are visible.
How to reason about it
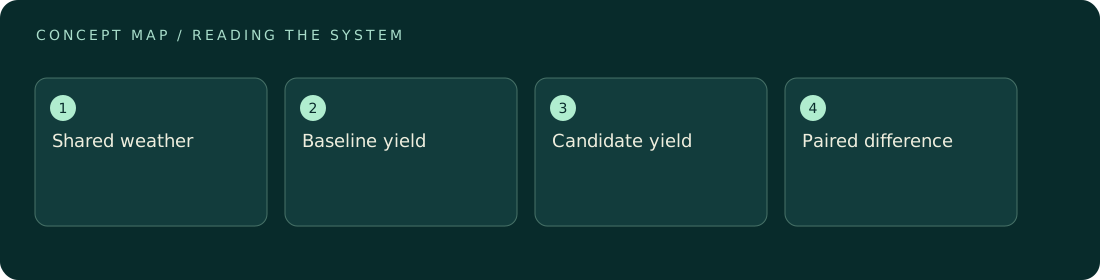
Fog supply varies in concentration, droplet sizes, wind, direction, and duration. Drainage introduces another timescale, so short events can favor a design that begins delivering water quickly even if its later rate is lower. The cited kirigami paper discusses this distinction between collection rate and event-total yield. For an original field-analysis framework, treat an event as the comparison unit and keep paired observations together. Document equal frontal area or explicitly normalize differing areas. If devices occupy different positions, a position swap across comparable runs can help reveal persistent location bias, though it does not remove all time effects. Summarize the distribution of paired differences instead of only the best event. Include zero-yield and interrupted intervals according to a declared rule so the analysis does not select favorable weather after seeing results.
ILLUSTRATIVE · NOT A REPORTED RESULT
An example to work through
Assume a baseline collects 100 milliliters and a candidate collects 120 milliliters during the same hypothetical event with matched areas. The candidate's gain is 20 milliliters, or 20% relative to baseline. In a second paired event, values are 10 and 8 milliliters, a 20% loss. Total collection is 110 versus 128 milliliters, a 16.4% aggregate gain. Averaging the two percentage changes gives zero instead, answering a different weighting question. Neither summary alone describes consistency across the two observed paired events.
Where interpretation fails
Selecting only productive events can inflate apparent performance and hide failure under common conditions. Averaging event percentages also gives a tiny baseline event the same weight as a large one. State the aggregation rule rather than treating every percentage summary as interchangeable.
The next decision
Use paired event records, show absolute yields, and declare how totals and percentages are computed. Investigate position and weather differences before attributing gains to design. Prefer a claim bounded to the observed conditions over a universal ranking from a few favorable field intervals.
Sources & context
These sources support the concepts noted below. Our synthetic examples and research framing are educational interpretation; they are not findings from these organizations or validation of our ventures.
- Kirigami fog nets: how strips improve water collection ↗
Event duration and drainage timing affect total harvest; comparison framework is original.
Source check: Search-result abstract or official excerpt reviewed; full paper methods not audited
Educational research context, not a validated device specification or clinical protocol. Read our editorial and correction policy.