

The essential answer
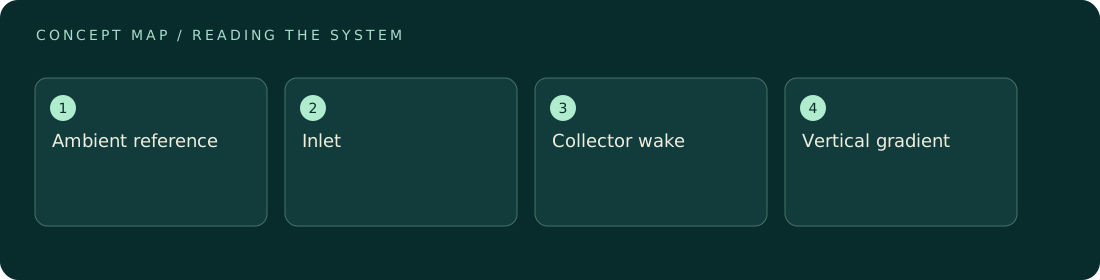
A sensor measures conditions where it samples, not automatically the conditions entering an entire collector. A droplet probe behind a mesh may observe depleted or diverted flow; a wind sensor in a wake may understate the upstream supply. Placement therefore defines the interpretation. Distinguish ambient reference measurements, inlet characterization, and downstream response. Use spatial context and synchronized timing before treating a local reading as evidence of device efficiency or a site's water resource.
How to reason about it
Every sensor has a sampling volume, response time, and interaction with its surroundings. A collector can change local velocities and droplet trajectories, while nearby terrain or structures can produce gradients that exist even without the device. The cited fog-profile study demonstrates that liquid water content has vertical structure. For an original design review, sketch the collector, prevailing flow, terrain, and sensor locations on one coordinate system. Then ask which measurement estimates supply and which estimates response. A downstream change is interpretable only against comparable upstream conditions and transport delays. Moving one instrument between positions can help identify spatial differences, but time variability may then confound the comparison. Simultaneous reference measurements provide a way to separate those effects. Record heights, distances, orientation, and missing-data intervals alongside values.
ILLUSTRATIVE · NOT A REPORTED RESULT
An example to work through
Assume two simultaneous LWC sensors read 0.10 and 0.20 grams per cubic meter at different heights, while all other inputs to a simple yield model are held fixed. Choosing the higher reading doubles the predicted incoming liquid budget. That factor of two is a placement sensitivity, not evidence that the collector changed performance. The example assumes both sensors are accurate and calibrated alike. A diagnostic comparison would first ask whether the collecting area spans those heights and whether either location sits inside a disturbed flow region.
Where interpretation fails
Placing an upstream reference too close to the collector can make it part of the disturbed flow. Moving it far away may instead expose it to a different fog patch. There is no universally correct distance independent of geometry, terrain, wind, and the instrument's sampling behavior.
The next decision
Define the measurement's role before choosing its location. Use a clear placement diagram, matched timing, and a sensitivity analysis across plausible spatial conditions. If representativeness cannot be established, report local measurements as local observations and keep whole-device efficiency estimates conditional.
Sources & context
These sources support the concepts noted below. Our synthetic examples and research framing are educational interpretation; they are not findings from these organizations or validation of our ventures.
- Vertical profiles of liquid water content in fog layers during SOFOG3D ↗
Observed vertical structure motivates spatially explicit sampling.
Source check: Search-result abstract or official excerpt reviewed; full paper methods not audited
Educational research context, not a validated device specification or clinical protocol. Read our editorial and correction policy.