

The essential answer
Calcium imaging usually measures a reporter response associated with calcium rather than calcium concentration directly. Fluorescence intensity, ratios, or lifetime can encode different information and require different calibrations. A larger optical signal may reflect a calcium change, reporter abundance, background, or acquisition conditions. Readout interpretation therefore needs a defined baseline and measurement model. In cultured cells, a calcium transient can support a signaling observation without by itself proving improved tissue function or a human benefit.
How to reason about it
A common normalized signal is delta F over F0: fluorescence change divided by baseline fluorescence. This reduces some scale differences but does not automatically convert the signal into concentration. Reporter sensitivity, saturation, kinetics, photobleaching, and cell motion can affect the trace. The cited lifetime-based calcium-sensor study illustrates that measurement design matters for quantitative interpretation. For an original analysis, keep amplitude, event frequency, duration, and fraction of responding cells separate. A population average can rise because each cell responds more strongly or because more cells respond at all. Those explanations imply different biology. Also align the time resolution with the event being interpreted: a slowly sampled series may miss brief peaks. A claim about calcium signaling should state the reporter, signal units, normalization, and the limits of any concentration conversion.
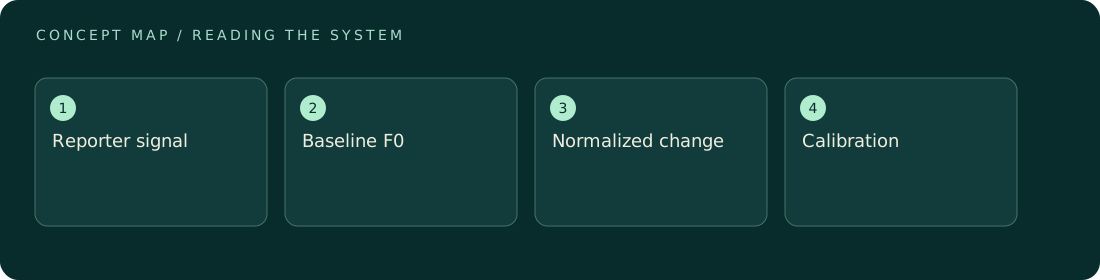
ILLUSTRATIVE · NOT A REPORTED RESULT
An example to work through
Assume a hypothetical cell has baseline fluorescence F0 of 100 units and a peak of 140 units after background correction. Delta F over F0 is 40 divided by 100, or 0.40. A second cell with baseline 200 and peak 240 has the same absolute increase but a normalized response of 0.20. Neither value alone specifies calcium concentration. This example assumes comparable acquisition and stable baselines; it demonstrates how the denominator changes the readout rather than establishing a biological difference between real cells.
Where interpretation fails
A brighter image may contain more reporter rather than more calcium. Averaging only visibly responsive cells can also exaggerate a population response. Do not equate fluorescence amplitude with firing rate, calcium concentration, or health unless the relevant relationship has been established for that system.
The next decision
Report the signal definition and show how baselines and responding cells were selected. Use calibration when making concentration claims, and preserve uncertainty from reporter kinetics or saturation. Pair calcium observations with the specific functional endpoint of interest instead of treating the trace as a universal success metric.
Sources & context
These sources support the concepts noted below. Our synthetic examples and research framing are educational interpretation; they are not findings from these organizations or validation of our ventures.
- A turquoise fluorescence lifetime-based biosensor for quantitative intracellular calcium imaging ↗
Reporter modality and quantitative calcium-imaging considerations.
Source check: Search-result abstract or official excerpt reviewed; full paper methods not audited
Educational research context, not a validated device specification or clinical protocol. Read our editorial and correction policy.