

The essential answer
Illustrative signal values 10, 20, 40, and 80 units at equal ten-minute intervals fit exponential doubling perfectly. They are consistent with replication, but also with an exponential change in detection gain applied to a constant amount of material. A growth curve alone does not distinguish those stories. Inferring replication requires an observable tied to newly produced entities or information, along with controls that constrain alternative explanations for the signal.
How to reason about it
An exponential model y(t)=y₀exp(kt) describes a pattern of proportional change. It does not specify whether the changing quantity is molecule number, compartment count, fluorescence yield, detector gain, or an analysis threshold effect. More than one causal model can produce the same observed series. Origin-of-life arguments become stronger when they separate membrane growth, physical division, and copying of an informational polymer. The laboratory source distinguishes those goals; the signal and alternative detector model below are purely illustrative. A useful analysis lists what is directly observed, what is inferred through calibration, and which additional observation would separate competing mechanisms. Even genuine chemical amplification would require further evidence before supporting claims about inheritance or sustained evolution across generations.
ILLUSTRATIVE · NOT A REPORTED RESULT
An example to work through
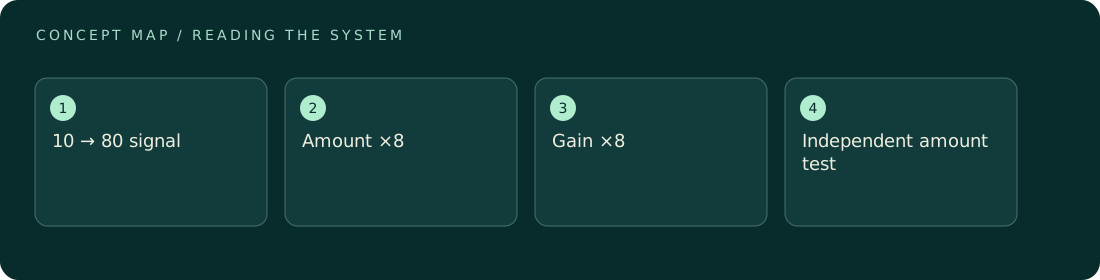
Use illustrative observations at t=0,10,20,30 minutes: y=10,20,40,80 arbitrary units. Each ratio is 2, so the fitted rate constant is k=ln(2)/10=0.0693147 min⁻¹. The doubling time is ln(2)/k=10 minutes. Model A says material amount N(t)=10exp(kt) with detector gain g=1. Model B says amount N=10 remains constant while gain g(t)=exp(kt). Since observed y=gN, both models predict exactly the same four values. At 30 minutes, Model A has amount 80 and gain 1, while Model B has amount 10 and gain 8. An independent calibrated amount measurement at that time would therefore predict an eightfold difference between the models. A reference signal experiencing the same detector gain could also diagnose Model B: it would increase eightfold despite constant reference amount. These are proposed discriminating observations within a synthetic example, not claims about an actual instrument or prebiotic experiment.
Where interpretation fails
A straight line on a logarithmic plot tests a functional form over the sampled range, not the truth of a replication mechanism. Subtracting a poorly known background before taking logarithms can also distort early points. The apparent growth rate may depend on calibration and the interval selected for fitting.
The next decision
Use the exponential fit to summarize the observed signal, then identify a measurement that separates increased amount from increased sensitivity. Do not promote a signal-doubling time into a replication time until that bridge is supported. For origin claims, separately assess information copying, compartment behavior, and persistence across cycles.
Sources & context
These sources support the concepts noted below. Our synthetic examples and research framing are educational interpretation; they are not findings from these organizations or validation of our ventures.
- Szostak Lab: Replicating Vesicles ↗
Membrane growth and division are distinct from replication of contained RNA.
Source check: Official laboratory search excerpt reviewed; direct page fetch failed
Educational research context, not a validated device specification or clinical protocol. Read our editorial and correction policy.