
The essential answer
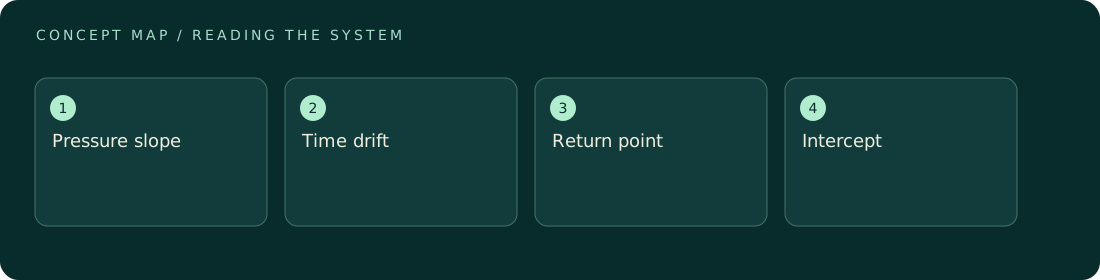
An illustrative force signal that increases from 12 to 30 nanonewtons as pressure rises from 10 to 100 pascals has slope 0.20 nanonewtons per pascal and a fitted zero-pressure intercept of 10 nanonewtons. That intercept is a model extrapolation, not a direct vacuum measurement. A linear trend can reveal pressure dependence, but it cannot uniquely identify its physical mechanism or establish that the residual is the desired effect.
How to reason about it
Write the diagnostic model as F(p)=F₀+bp over the limited range being studied. The intercept groups everything independent of pressure within that range, including an intended signal, a sensor offset, and unmodeled backgrounds. A good fit therefore partitions mathematical behavior rather than certifying a mechanism. Pressure and elapsed time must be separated: a monotonically ordered sweep can make thermal drift look like pressure dependence. Conceptually, alternate or randomize pressure order and include repeats at a reference point. Compare increasing and decreasing sequences for hysteresis. The educational calculation assumes pressure values are exact, residual errors are comparable, and a linear response is adequate. Real pressure uncertainty, lag, and correlated readings can invalidate an ordinary least-squares interpretation even when the plotted line looks convincing.
ILLUSTRATIVE · NOT A REPORTED RESULT
An example to work through
Use five illustrative pressure values p=(10,30,50,70,100) Pa and synthetic force values F=(12,16,20,24,30) nN. The endpoint slope is (30−12)/(100−10)=18/90=0.20 nN/Pa. Each intermediate point lies on the same line, so F₀=12−0.20×10=10 nN. At 50 Pa, the modeled pressure-dependent contribution is 10 nN and the total is 20 nN: half the total comes from that term. Now construct a second synthetic story: keep pressure effects absent, run points at t=(0,20,40,60,90) minutes, and let an offset drift as 12+0.20t nN. It produces exactly the same force list. Because p=t+10 numerically in this schedule, pressure and time are perfectly confounded. A return to 10 Pa at t=100 minutes would predict 12 nN under the pressure model but 32 nN under the drift model, a conceptual separation of 20 nN.
Where interpretation fails
A zero-pressure intercept is often described too confidently as a background-free force. Extrapolation retains every pressure-independent offset and depends on the chosen functional form. Curvature below the measured range could change the intercept substantially. Synthetic exact collinearity also supplies no empirical estimate of instrumental noise or repeatability.
The next decision
Choose a diagnostic schedule that breaks the link between pressure and time, then compare competing predictions. For this teaching case, the return point is more informative than another point along the same ordered sweep. Do not label the residual as a new physical effect without independent offset and thermal checks.
Sources & context
These sources support the concepts noted below. Our synthetic examples and research framing are educational interpretation; they are not findings from these organizations or validation of our ventures.
- NIST: Randomized Block Designs ↗
Blocking separates an investigated factor from controlled nuisance factors.
Source check: Definition and rationale read
Educational research context, not a validated device specification or clinical protocol. Read our editorial and correction policy.