

The essential answer
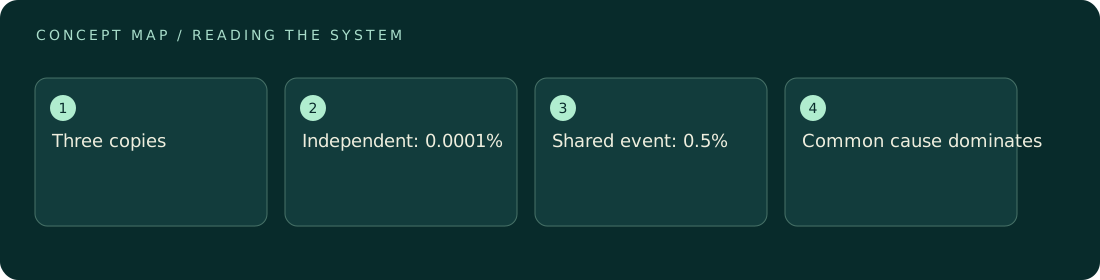
With illustrative independent annual loss probability 1 percent per copy, three copies would all be lost with probability one in a million. Add a 0.5 percent common-cause event that destroys all copies, and the modeled total becomes about 0.5001 percent. The common cause dominates. Copy count alone is therefore an incomplete preservation metric; independence of locations, credentials, update paths, and recovery processes matters to what redundancy actually protects.
How to reason about it
The probability that independent events all occur is the product of their probabilities. That multiplication is valid only under the independence model. Shared credentials, synchronized deletion, common software, or a single physical location can create joint failures that cannot be represented by simply multiplying individual rates. A two-part model first considers a common event and then, conditional on its absence, independent losses. This keeps the two contributions mutually exclusive and avoids double counting. The NASA source provides general risk-management context; the probabilities here are invented and are not empirical reliability estimates for any service. Redundancy also differs from recoverability: surviving bytes are useful only if authorized users can find, verify, decode, and restore the intended version when needed.
ILLUSTRATIVE · NOT A REPORTED RESULT
An example to work through
Assume illustrative per-copy loss probability p=0.01 over one year and three conditionally independent copies. Without a common cause, total loss probability is p³=0.000001, which is 0.0001 percent. Now assign common-cause probability q=0.005. If that event occurs, all copies are lost; otherwise each has conditional independent loss probability p. Then P(total loss)=q+(1−q)p³=0.005+0.995×0.000001=0.005000995, or 0.5000995 percent. Adding a fourth copy changes the result to 0.005+0.995×0.00000001=0.00500000995, only a small improvement. Instead, if a revised architecture lowers q to 0.0001 while retaining three copies, the model gives 0.0001+0.9999×0.000001=0.0001009999, or 0.01009999 percent. This comparison is conditional on assumed probabilities, but it demonstrates why reducing shared failure exposure can outweigh merely increasing copy count. It does not establish an operational guarantee.
Where interpretation fails
The word independent cannot be justified by different folder names or storage devices alone. Copies synchronized by one deletion command can fail together even when geographically separated. Conversely, multiplying annual probabilities over many years without considering repair, replacement, or changing conditions produces an unjustified lifetime estimate.
The next decision
Map the failures that can reach every copy before choosing a redundancy strategy. For this teaching model, common-cause reduction has more effect than a fourth copy. Pair redundancy with version history, fixity checks, and recovery exercises, while keeping real risk estimates separate from these illustrative probabilities.
Sources & context
These sources support the concepts noted below. Our synthetic examples and research framing are educational interpretation; they are not findings from these organizations or validation of our ventures.
- NASA: Technical Risk Management ↗
Risk assessment connects likelihood, consequences, and mitigation.
Source check: Official handbook page browsed
Educational research context, not a validated device specification or clinical protocol. Read our editorial and correction policy.