

The essential answer
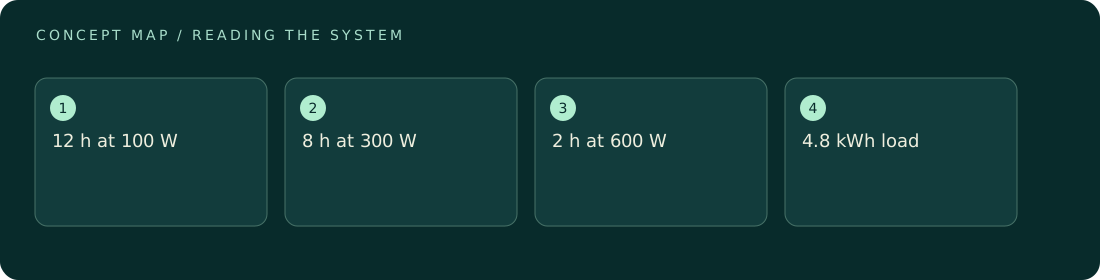
The illustrative daily schedule consumes 4.8 kilowatt-hours at the load. At a fixed 80 percent conversion efficiency, supplying that schedule requires 6.0 kilowatt-hours upstream. The maximum load is 600 watts, but multiplying that peak by a full day would predict 14.4 kilowatt-hours and misrepresent the schedule. Conversely, energy capacity alone cannot establish whether a supply can deliver the peak. Power and energy answer different design questions.
How to reason about it
Energy is the time integral of power. For a piecewise constant schedule, the integral becomes a sum of power multiplied by duration. Keep the time unit explicit: watts multiplied by hours give watt-hours, whereas watts multiplied by seconds give joules. A conversion efficiency translates load energy into source energy only if the efficiency model matches operation. A single fixed efficiency is useful for teaching but may fail at very low load, during startup, or across temperature changes. Standby draw belongs in the load schedule rather than being silently omitted. The calculation also excludes reserve margin, capacity aging, and charging constraints. Those exclusions are boundaries of the example, not claims that a real system can operate indefinitely with the nominal energy budget.
ILLUSTRATIVE · NOT A REPORTED RESULT
An example to work through
Use this illustrative 24 hour schedule: 100 W for 12 hours, 300 W for 8 hours, and 600 W for 2 hours, followed by zero load for 2 hours. The durations sum to 12+8+2+2=24 hours. Energy is 100×12+300×8+600×2=1200+2400+1200=4800 Wh, or 4.8 kWh. Average power is 4800/24=200 W. Peak power is 600 W, three times the average. At efficiency η=0.80, upstream energy is 4800/0.80=6000 Wh. Conversion loss is 6000−4800=1200 Wh, which is 20 percent of input and 25 percent of useful output. If the zero-load interval actually has a 10 W standby draw, add 10×2=20 Wh at the load; total source energy becomes 4820/0.80=6025 Wh. The small addition demonstrates how the system boundary controls accounting. Every number is synthetic and represents a schedule assumption rather than an appliance measurement.
Where interpretation fails
Efficiency losses are sometimes added as 20 percent of output when efficiency is 80 percent, producing too little input energy. Divide useful output by efficiency instead. Also avoid averaging power levels without duration weights: the schedule spends unequal time in each state, so their simple arithmetic mean is inappropriate.
The next decision
Report both the 600 W peak and the 4.8 kWh daily load energy. Use the integral to compare operating schedules and a separate power requirement to assess instantaneous delivery. Before making a real capacity decision, replace the assumed schedule and efficiency with evidence covering representative operating conditions.
Sources & context
These sources support the concepts noted below. Our synthetic examples and research framing are educational interpretation; they are not findings from these organizations or validation of our ventures.
- NASA: First Law of Thermodynamics ↗
Energy accounting distinguishes transfers and stored energy.
Source check: Full short educational page read
Educational research context, not a validated device specification or clinical protocol. Read our editorial and correction policy.