

The essential answer
Impedance spectroscopy measures the relation between a small oscillating electrical perturbation and its response across frequency. The resulting complex quantity contains amplitude and phase information. Interpreting it usually assumes a sufficiently linear and stable operating state during measurement. Equivalent circuits can summarize features, but different physical systems may produce similar spectra. A good fit therefore does not uniquely identify a mechanism. Report excitation amplitude, bias, frequency range, and state, then validate the interpretation with additional conditions or time-domain predictions.
How to reason about it
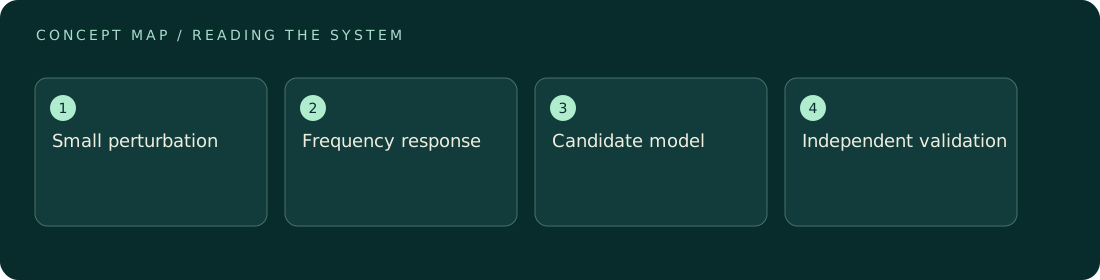
At each frequency, impedance compares the sinusoidal voltage and current response using a defined sign convention. Resistive, capacitive, interfacial, and transport processes can contribute over overlapping ranges. A low-frequency point may require a long observation, making drift especially important. Check amplitude dependence to assess whether the small-signal approximation is adequate and repeat selected frequencies to look for state evolution. Choose a circuit because its elements express a plausible model, not merely because enough parameters can follow the curve. Parameter uncertainty and correlation matter: two fitted values may trade off while the predicted spectrum remains almost unchanged. Compare models using independent evidence such as geometry changes, temperature dependence, or a held-out transient. State clearly when an element is phenomenological. This turns impedance from a decorative semicircle plot into a constrained test of how the system responds around a particular operating point.
ILLUSTRATIVE · NOT A REPORTED RESULT
An example to work through
Assume a hypothetical ideal parallel resistor-capacitor element with R = 1,000 ohms and C = 1 microfarad. Its characteristic angular frequency is 1/(RC) = 1,000 radians per second, corresponding to about 159 Hz. At that frequency its impedance is 500 − 500i ohms under the usual exp(iωt) convention, with magnitude about 707 ohms. These values follow from the specified circuit, not a material measurement. Observing a similar feature in data would not alone prove that the sample contains one literal resistor and one literal capacitor or exclude distributed processes.
Where interpretation fails
A fitted semicircle is not a chemical fingerprint. Wiring inductance, contact effects, drift, and overlapping processes can alter its shape. Reporting many precise circuit parameters without identifiability checks can imply information that the measured frequency range does not actually contain. Keep model and measurement claims distinct.
The next decision
Check stability and amplitude dependence before interpreting the spectrum. Fit the simplest physically defensible model, report uncertainty, and test a prediction outside the fit. If several models remain plausible, retain that ambiguity and describe robust spectral features rather than assigning unsupported microscopic mechanisms.
Sources & context
These sources support the concepts noted below. Our synthetic examples and research framing are educational interpretation; they are not findings from these organizations or validation of our ventures.
- Nonlinear electrochemical impedance spectroscopy for lithium-ion battery model parameterization ↗
Primary study background on excitation assumptions, parameter identifiability, and time-domain validation.
Source check: Primary preprint abstract opened and reviewed; full paper not reviewed.
Educational research context, not a validated device specification or clinical protocol. Read our editorial and correction policy.