
The essential answer
Drift is a time-dependent change in the measuring system that can mimic a condition-dependent signal when conditions are tested in sequence. A baseline before a long run may not represent the baseline during it. Interleaving, bracketing, and balanced switching reduce this ambiguity by making time and condition less confounded. These strategies work only within stated assumptions about the drift timescale and smoothness. Retain timestamps and monitor influential variables so that a fitted trend can be tested rather than accepted as an unexplained correction.
How to reason about it
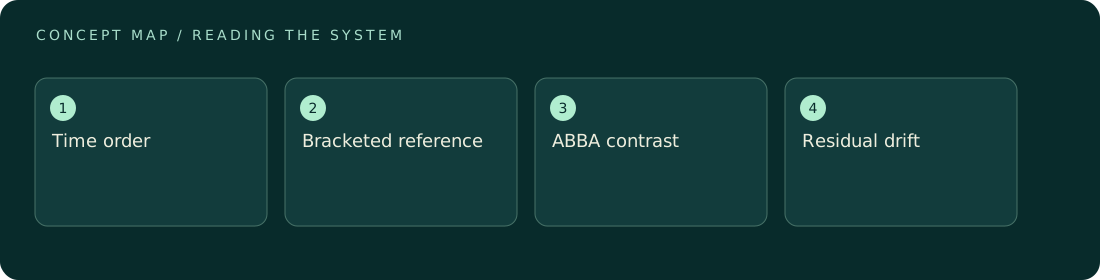
A straight-line drift can be estimated from reference readings on either side of a test interval. Interpolation is usually safer than extrapolation because both endpoints constrain the local baseline. An ABBA sequence balances the mean times of conditions A and B and therefore cancels an additive linear drift in their mean difference when spacing is uniform. Curvature, sudden steps, hysteresis, and condition-dependent recovery do not automatically cancel. Plot raw output against time before subtracting a trend. A high-order polynomial can remove a real slowly varying signal as easily as a nuisance. Prefer a drift model justified by independent reference data, and vary switching periods to test its adequacy. Temperature and power records may explain the physical source, but correlation alone does not establish a correction coefficient. Use calibration or controlled perturbations to determine that coefficient.
ILLUSTRATIVE · NOT A REPORTED RESULT
An example to work through
For an illustrative ABBA sequence at times 0, 1, 2, and 3 minutes, suppose drift adds 0.4 nN per minute and condition B adds 2 nN. The four readings are 0, 2.4, 2.8, and 1.2 nN. Mean B is 2.6 nN; mean A is 0.6 nN; their difference is exactly 2 nN. A simple A-then-B pair at the first two times would instead give 2.4 nN. This algebra assumes identical settling and additive linear drift; it does not guarantee cancellation for a real apparatus.
Where interpretation fails
Fitting drift to the same test data used to estimate the signal can make the answer depend strongly on model flexibility. A drift curve that follows every excursion may erase the effect of interest. Preserve the uncorrected trace and show how independent reference information constrains the chosen baseline.
The next decision
Choose the switching interval short enough that reference behavior is predictable, but long enough for the relevant response to settle. Accept a drift correction only if held-out references and alternative balanced sequences give compatible contrasts. Treat sudden jumps or hysteresis as separate failure modes rather than smoothing them away.
Sources & context
These sources support the concepts noted below. Our synthetic examples and research framing are educational interpretation; they are not findings from these organizations or validation of our ventures.
- NIST Handbook of Frequency Stability Analysis ↗
Further reading on stability statistics; publication summary checked.
Source check: Relevant excerpt or resource metadata checked; see support note. Original illustrative calculation, not source data.
Educational research context, not a validated device specification or clinical protocol. Read our editorial and correction policy.