
The essential answer
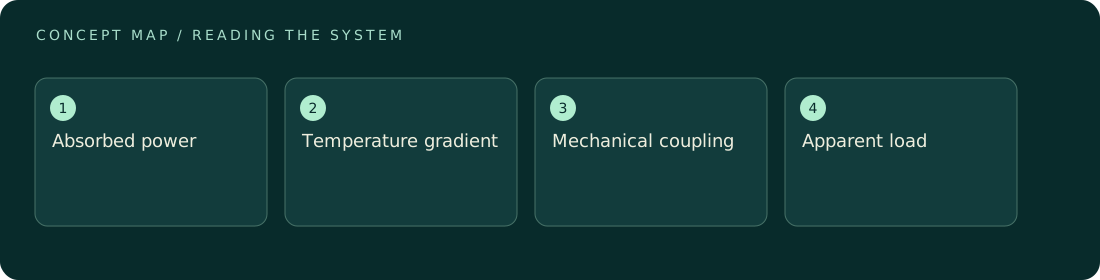
Heating can create apparent or real forces through expansion, bending, gas motion, changing material properties, and readout drift. A signal that scales with optical power is therefore not automatically radiation pressure: absorbed power often scales with incident power too. Thermal effects may be delayed, but some are fast on the measurement timescale. Use measured temperature responses, heater controls, modulation-frequency dependence, and geometrical changes to separate pathways. Report the residual thermal uncertainty even when a correction is applied.
How to reason about it
Begin by locating where power is absorbed: coating, substrate, beam stop, chamber wall, or detector. Each location has a different route to the force sensor. Expansion can move the beam spot, bend a suspension, or change a cable load without producing a net external force on the complete assembly. Temperature gradients in gas can produce an actual external load. Sensor gain and zero may also depend on temperature. A lumped thermal model with heat capacity C and conductance G has time constant C/G, but several bodies often require multiple time constants. A heater control should reproduce relevant spatial heating, not merely the total wattage. Comparing light and heater responses becomes persuasive only when their temperature distributions and mechanical coupling are adequately matched. Retain transient records rather than discarding the periods most useful for identifying the thermal pathway.
ILLUSTRATIVE · NOT A REPORTED RESULT
An example to work through
Assume a hypothetical 20 mm support has linear expansion coefficient 10×10⁻⁶ K⁻¹ and warms by 0.2 K. Its length change is 0.020×10×10⁻⁶×0.2 = 40 nm. If that displacement loads a 0.05 N/m flexure, the resulting force is 2 nN. The calculation assumes expansion projects completely onto the sensitive direction and the flexure remains linear. A symmetric mount might greatly reduce the coupling, while bending could increase it. Measuring the geometry-dependent coupling is therefore more informative than quoting temperature stability alone.
Where interpretation fails
A thermometer far from the absorption site may miss the gradient that matters. Likewise, a delayed signal is suggestive but not conclusive: mechanical filters can delay radiation-pressure responses, and thin absorbing layers can heat quickly. Compare calibrated transfer functions rather than relying on the visual shape of one trace.
The next decision
Set an explicit thermal allowance and test it with controlled temperature or heater perturbations large enough to measure coupling reliably. Verify that scaling back to operating conditions is justified. If the spatial heating cannot be reproduced, use conservative bounds and redesign the absorption path or mechanical symmetry before claiming a smaller uncertainty.
Sources & context
These sources support the concepts noted below. Our synthetic examples and research framing are educational interpretation; they are not findings from these organizations or validation of our ventures.
- The NIST Length Scale Interferometer ↗
Temperature and environmental corrections; relevant article passages checked.
Source check: Relevant excerpt or resource metadata checked; see support note. Original illustrative calculation, not source data.
Educational research context, not a validated device specification or clinical protocol. Read our editorial and correction policy.