

The essential answer
A residual is the difference between an observation and its model prediction under a stated sign convention. Residual diagnostics ask whether those differences contain structure that the model should explain or that the uncertainty model should accommodate. Plot them against fitted values, inputs, time, and relevant groups rather than relying on one summary score. A pattern is a clue, not an automatic diagnosis. It may arise from missing physics, measurement problems, dependence, changing variance, or a mismatch between the fitted objective and the intended prediction.
How to reason about it
A curved residual trend can suggest an inadequate functional form. A widening spread can indicate that uncertainty changes with signal level. Long runs of one sign over time can reveal dependence, drift, or an omitted operating change. Grouped offsets may expose calibration differences or an unmodeled batch effect. Interpret these patterns using the measurement process and experimental design rather than selecting transformations mechanically. Residuals computed on training data have been shaped by the fit and may appear reassuring even when predictive errors are poor. Out-of-sample residuals address a different and often more relevant question. For repeated observations, inspect within-group behavior as well as pooled plots. Record the sign convention, any normalization, and whether residuals are raw, standardized, or otherwise transformed. Finally, test the proposed explanation with new information instead of using the same pattern both to invent and conclusively confirm a repair.
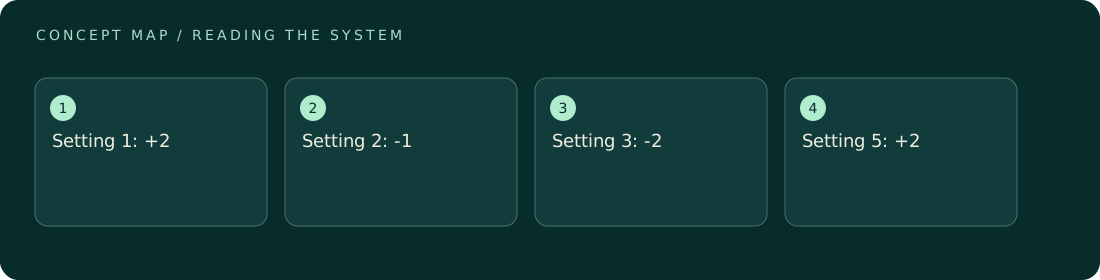
ILLUSTRATIVE · NOT A REPORTED RESULT
An example to work through
Assume five equally spaced operating settings produce observed-minus-predicted residuals of 2, -1, -2, -1, and 2 units. Their mean is zero, yet the U-shaped sequence is not well described by a claim of no systematic error. The squared residuals sum to 14, giving root mean squared residual sqrt(14/5), approximately 1.67 units. That single number does not reveal the curvature. A plausible diagnostic step is to inspect whether the model omitted a quadratic response or whether the endpoints were measured under different conditions. This synthetic sequence suggests questions; it does not establish the cause.
Where interpretation fails
Removing large residuals merely because they weaken the fit can erase the evidence of model failure. Investigate their provenance and use a documented exclusion rule. A visually random cloud is also not proof of independence or correct uncertainty, especially with few observations or heavily fitted training data.
The next decision
Use residual plots before expanding model complexity. If a pattern corresponds to a known physical or measurement mechanism, design a targeted correction and assess it on fresh or properly held-out data. If no explanation is established, report the pattern as an unresolved limitation rather than hiding it behind a high fit statistic.
Sources & context
These sources support the concepts noted below. Our synthetic examples and research framing are educational interpretation; they are not findings from these organizations or validation of our ventures.
- NIST: How can I tell if a model fits? ↗
Residual plots reveal inadequacies hidden by summary fit statistics.
Source check: Official handbook HTML opened.
Educational research context, not a validated device specification or clinical protocol. Read our editorial and correction policy.