

The essential answer
A dose-response relationship connects an exposure level with a defined outcome under specified conditions. The curve depends on endpoint, duration, cell system, and analysis method. Potency and maximum effect are different properties, and a single concentration cannot establish the full curve. In vitro concentration-response data do not directly provide a human dose, clinical benefit, or safety margin. Interpret the measured response within the experiment's scope and preserve uncertainty about unobserved regions.
How to reason about it
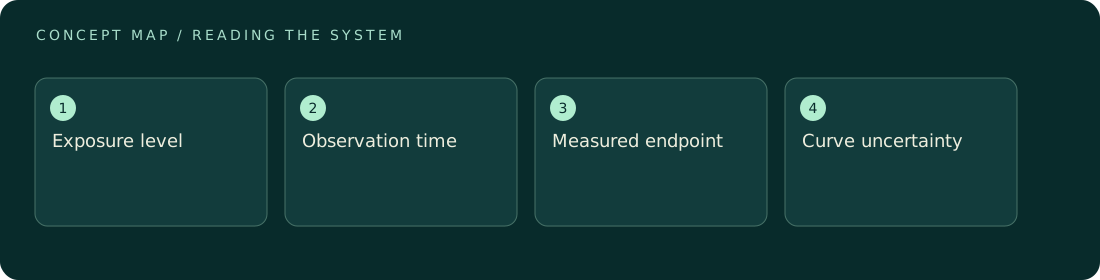
A fitted curve is a model of observations, not a guarantee of behavior beyond them. Baseline growth can influence endpoint cell-count or viability comparisons, as the cited primary growth-rate study demonstrates. An apparent difference in sensitivity can therefore arise partly from different numbers of divisions during observation. For original interpretation, separate the raw measurements, normalization, fitted parameters, and biological conclusion. Check whether observations cover both low-response and high-response regions before trusting a midpoint estimate. If the curve never reaches a plateau, maximum effect may be poorly identified. A steep-looking curve based on sparse points can also hide uncertainty. Compare curves only when endpoints and times are compatible, and state whether the response represents cell number, growth inhibition, signaling, or another quantity. Those outcomes cannot be exchanged merely because they share a percentage axis.
ILLUSTRATIVE · NOT A REPORTED RESULT
An example to work through
Assume an illustrative response model R equals 100 times c divided by K plus c, where c is concentration in arbitrary units and K equals 2. At c equal to 2, R is 50; at c equal to 6, R is 75. Tripling concentration does not triple response because the model saturates. These are synthetic model values, not experimental data or dosing instructions. The calculation assumes the model is appropriate and says nothing about viability, human exposure, or whether the same parameters apply at another observation time.
Where interpretation fails
A fitted midpoint can look precise even when measurements do not bracket it. Comparing curves obtained at different durations may confuse exposure time with sensitivity. Never translate an in vitro concentration directly into a human dose or interpret a cellular response percentage as a clinical success probability.
The next decision
Name the endpoint, time window, normalization, and independent replicate structure before interpreting curve parameters. Show observations alongside the fit and flag extrapolation. If growth differs across conditions, consider its effect on the metric. Keep the conclusion specific to the tested cellular system and measured response.
Sources & context
These sources support the concepts noted below. Our synthetic examples and research framing are educational interpretation; they are not findings from these organizations or validation of our ventures.
- Growth rate inhibition metrics correct for confounders in measuring sensitivity to cancer drugs ↗
Primary analysis of growth-rate confounding in in vitro response metrics.
Source check: Search-result abstract or official excerpt reviewed; full paper methods not audited
Educational research context, not a validated device specification or clinical protocol. Read our editorial and correction policy.