

The essential answer
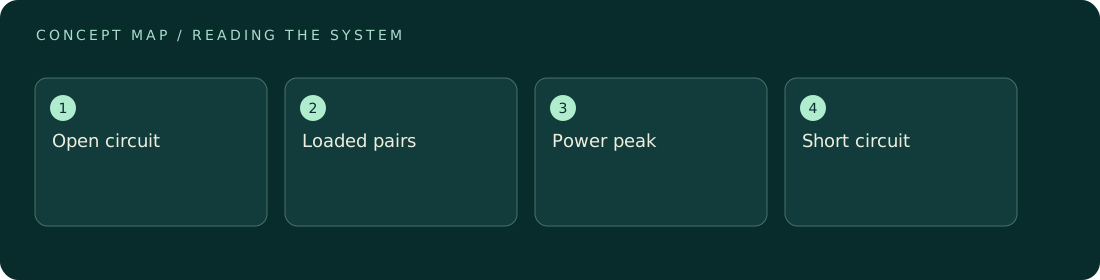
A current-voltage curve records how a device responds across electrical operating conditions. Each point pairs a voltage with its simultaneous current. Power belongs to that pair: P = VI. Open-circuit voltage and short-circuit current occur at different conditions and must not be multiplied to claim delivered power. The largest measured product along a properly stabilized curve estimates a maximum-power point for the tested state. A curve is not timeless: temperature, illumination, chemical state, and sweep protocol can all matter.
How to reason about it
A useful curve starts with a clear convention for current direction and whether the instrument sources or receives electrical power. Choose the voltage or load range so it does not inadvertently damage or irreversibly change the sample. Record the dwell time, sample timing, direction, and environmental conditions. A rapid scan can include capacitive current because the applied voltage itself changes stored charge. A slow scan can expose depletion or drift because the sample evolves during measurement. Comparing forward and reverse scans helps reveal this tension, but agreement alone does not prove every point is at equilibrium. Repeating selected fixed-load points is a stronger check of usable output. When comparing curves, preserve raw axes and units; normalized plots can hide differences in device area, total output, or the uncertainty near a peak.
ILLUSTRATIVE · NOT A REPORTED RESULT
An example to work through
Consider invented stabilized pairs of 0.10 V at 4 mA, 0.30 V at 3 mA, and 0.50 V at 1 mA. Their powers are 0.40, 0.90, and 0.50 mW. The largest sampled value is therefore 0.90 mW, although a finer scan might locate a slightly larger peak between points. Suppose a separate open-circuit reading is 0.60 V and a short-circuit reading is 5 mA. Their product, 3 mW, is not an available operating point. All values assume one unchanged sample state and negligible measurement uncertainty.
Where interpretation fails
A smooth line joining sparse data is an interpolation, not evidence that the device maintained every intermediate point. Another trap is overlooking instrument-supplied energy when a potentiostat actively biases the sample. Label the sign convention and report the electrical role of the instrument explicitly.
The next decision
Use the curve to select candidate operating points, then hold those points long enough to assess stability and energy delivery. Report maximum measured power as a result under specified conditions. If sweep direction changes the answer, retain both curves and investigate dynamics before presenting a single rating.
Sources & context
These sources support the concepts noted below. Our synthetic examples and research framing are educational interpretation; they are not findings from these organizations or validation of our ventures.
- Solar cell characterization — NIST ↗
Background on photovoltaic characterization and spectral measurement modes; no performance results reproduced.
Source check: Official PDF search excerpt reviewed.
Educational research context, not a validated device specification or clinical protocol. Read our editorial and correction policy.