

The essential answer
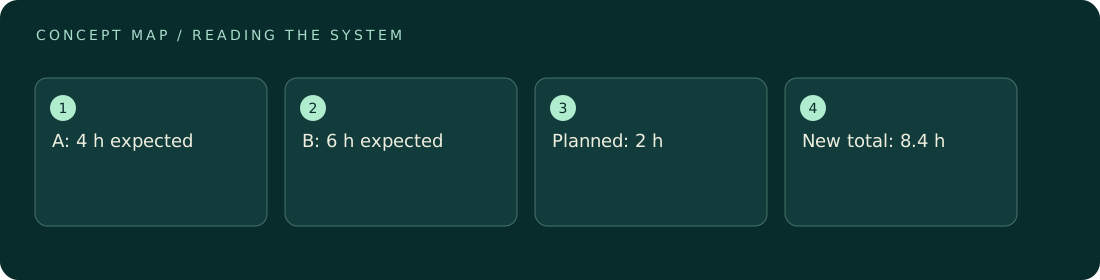
In an illustrative non-safety-critical service, failure mode A contributes 4 expected downtime hours per year and mode B contributes 6. Although B occurs less often, its longer recovery makes it the larger downtime contributor. A proposed maintenance action reducing B's probability from 0.05 to 0.02 cuts expected unplanned downtime by 3.6 hours, but adds 2 planned hours. Its net expected downtime benefit is therefore 1.6 hours per year under the stated assumptions.
How to reason about it
Expected downtime is a probability-weighted consequence metric. For a simple annual model with at most one occurrence of each mode, contribution equals annual occurrence probability multiplied by downtime conditional on occurrence. It is not a complete risk score: safety consequences, data loss, cost, correlated failures, and tail events can lead to different priorities. A maintenance action has its own planned downtime and can introduce new failure opportunities. Coverage also matters: reducing one failure mode leaves others unaffected. The NASA source supplies the broader risk-management framing. This example intentionally concerns an imaginary low-consequence service and invented probabilities. It demonstrates transparent arithmetic rather than prescribing maintenance intervals for equipment or claiming that an expected value guarantees annual performance.
ILLUSTRATIVE · NOT A REPORTED RESULT
An example to work through
Assume illustrative mode A has annual occurrence probability 0.20 and 20 hours downtime if it occurs. Its expected contribution is 0.20×20=4 hours. Mode B has probability 0.05 and 120 hours downtime, contributing 0.05×120=6 hours. If downtime contributions are additive without overlap, total expected unplanned downtime is 10 hours per year. Now consider an action that changes only B's probability to 0.02 and requires 2 planned hours annually. New B contribution is 0.02×120=2.4 hours. Total expected downtime becomes 4+2.4+2=8.4 hours, a reduction of 1.6 hours. The gross unplanned reduction is 6−2.4=3.6 hours. The action breaks even on this single metric when its planned downtime is 3.6 hours, assuming all other effects remain absent. If it also creates an illustrative 0.01 probability of a 50-hour maintenance-induced outage, add 0.5 hours; total becomes 8.9 hours and net benefit falls to 1.1 hours.
Where interpretation fails
Ranking only by failure frequency would prioritize A and miss B's larger downtime contribution. Ranking only by expected downtime can also hide rare severe consequences. The annual probability model differs from a failure-rate model allowing repeated events; substituting rates and probabilities without stating the event model changes the calculation.
The next decision
Use the expected-downtime comparison as one transparent input, then check whether the action actually addresses mode B and whether other consequences matter. For this constructed service, the proposed action improves the stated metric. No real maintenance policy follows until probabilities, repair durations, induced risks, and operational constraints are supported.
Sources & context
These sources support the concepts noted below. Our synthetic examples and research framing are educational interpretation; they are not findings from these organizations or validation of our ventures.
- NASA: Technical Risk Management ↗
Risk assessment connects likelihood, consequences, and mitigation.
Source check: Official handbook page browsed
Educational research context, not a validated device specification or clinical protocol. Read our editorial and correction policy.