

The essential answer
Sensitivity analysis measures how an output changes when an input changes under a stated model and operating condition. It can guide measurement effort, identify fragile decisions, and reveal interactions between assumptions. Sensitivity is different from uncertainty: a highly influential input may be known precisely, while a weakly influential one may vary widely. State the perturbation scale and whether the analysis is local or covers a broader input range. Rank inputs using a metric tied to the output and decision rather than an arbitrary raw derivative alone.
How to reason about it
A local derivative describes behavior near one reference point. It is useful for small perturbations, checking implementation, and constructing a first uncertainty estimate. A dimensionless elasticity compares fractional output changes with fractional input changes, making unlike units easier to compare when the reference values are nonzero. Global analyses explore a defined range or distribution and can expose nonlinearities and interactions that a local ranking misses. Neither approach is meaningful without stating which inputs vary together and which remain fixed. Changing correlated physical properties independently may create impossible cases. Also distinguish a model's sensitivity from the real system's response; a missing mechanism will remain missing throughout a parameter sweep. Document the selected output, baseline, perturbation size, feasible ranges, and computational noise floor so that small apparent effects are not merely artifacts of solver tolerances.
ILLUSTRATIVE · NOT A REPORTED RESULT
An example to work through
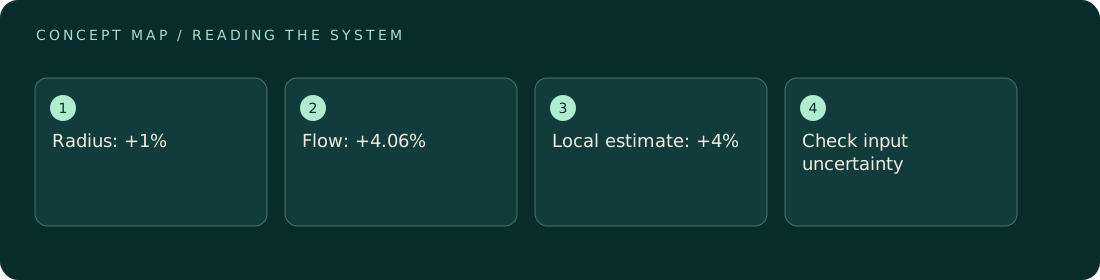
For an ideal laminar tube model, let volumetric flow be proportional to radius to the fourth power, with pressure difference, length, and viscosity fixed. A one-percent radius increase gives a flow ratio of 1.01 to the fourth power = 1.04060401, about a 4.06-percent increase. The local elasticity predicts approximately four percent. If radius uncertainty is only 0.1 percent but pressure uncertainty is five percent, pressure may dominate output uncertainty despite its lower elasticity of one. These invented tolerances illustrate why ranking derivatives and ranking uncertainty contributions can produce different priorities. The relation applies only while the assumed flow model remains appropriate.
Where interpretation fails
One-at-a-time perturbations can miss a situation where two inputs matter mainly through their interaction. Rankings can also reverse at a different operating point. Do not publish a universal statement that an input is unimportant when the calculation assessed only a narrow neighborhood around one convenient baseline.
The next decision
Use local sensitivity for early diagnosis and small uncertainty budgets. Expand to feasible ranges and joint variations when nonlinearities or interactions could change the decision. Spend effort where the product of influence and plausible uncertainty is consequential, and verify that any proposed input change remains within the model's physical regime.
Sources & context
These sources support the concepts noted below. Our synthetic examples and research framing are educational interpretation; they are not findings from these organizations or validation of our ventures.
- NIST: Combining uncertainty components ↗
First-order uncertainty propagation uses sensitivity coefficients and covariance.
Source check: Official HTML opened; propagation conditions inspected.
Educational research context, not a validated device specification or clinical protocol. Read our editorial and correction policy.