

The essential answer
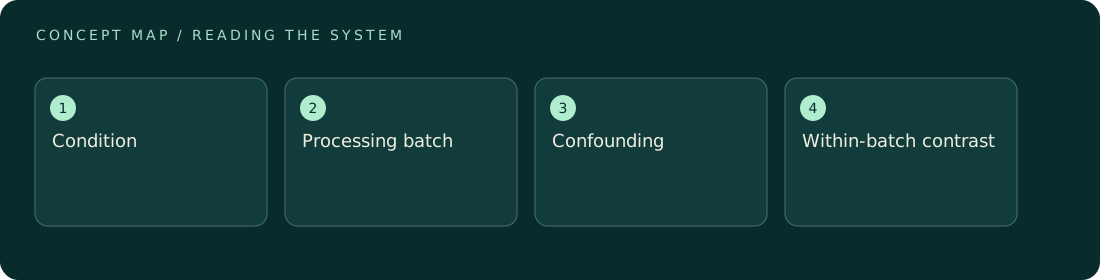
A batch effect is systematic variation associated with processing rather than the biological difference of interest. If all controls are processed in one batch and all comparison samples in another, batch and condition become inseparable from the observed data alone. Computational correction cannot reliably recover information the design never supplied. Balanced representation across batches and transparent metadata help distinguish technical shifts from biology. A visually cleaner corrected plot is not itself proof that the separation was correct.
How to reason about it
Batch can include collection date, operator, reagent lot, instrument run, or other shared conditions. Different sources can act together, and some may interact with biology. The cited primary single-cell study found substantial technical variation even with molecular counting strategies, illustrating that measurement technology does not erase design concerns. For original analysis, create a condition-by-batch table before interpreting a plot. Empty combinations reveal where contrasts rely on assumptions. Correction methods may remove technical structure, but they can also remove real differences if condition and batch overlap. Preserve raw data, corrected representations, and the assumptions linking them. Evaluate conclusions using appropriate independent units and sensitivity analyses rather than relying only on whether clusters mix after adjustment. The goal is a defensible comparison, not maximum visual uniformity across every sample.
ILLUSTRATIVE · NOT A REPORTED RESULT
An example to work through
Assume controls measured in batch A average 10 units and comparison samples measured in batch B average 15. A five-unit difference could be biological, technical, or a mixture; the design cannot separate them. Now imagine both conditions appear in both batches, with controls and comparisons differing by two units within each batch. That pattern supports a more interpretable condition contrast even if batch B is globally higher. These invented values illustrate confounding and balance, not a real correction result or a recommended analytical method.
Where interpretation fails
Perfect mixing on a low-dimensional plot can result from overcorrection. Conversely, remaining separation may reflect genuine biology rather than failed processing. Do not use visual overlap as the only quality criterion, and do not claim that an algorithm proves the absence of batch effects.
The next decision
Inspect the design table, metadata, and within-batch contrasts before correction. Document what the method assumes and test whether conclusions depend on it. If condition is completely confounded with batch, acknowledge the identification limit rather than presenting adjusted values as an unambiguous biological effect.
Sources & context
These sources support the concepts noted below. Our synthetic examples and research framing are educational interpretation; they are not findings from these organizations or validation of our ventures.
- Batch effects and the effective design of single-cell gene expression studies ↗
Primary experimental evidence of technical variation and design implications.
Source check: Article abstract and introduction reviewed
Educational research context, not a validated device specification or clinical protocol. Read our editorial and correction policy.